Interval Operations in Galaxy
A unique feature of Galaxy is the large number of tools for performing operations on genomic intervals. These tools are based on the bx-python package (https://github.com/bxlab/bx-python). These include ''intersect'', ''subtract'', ''complement'', ''merge'', ''concatenate'', ''cluster'', ''coverage'', ''base coverage'', and ''join''. Some operations are analogous to relational database queries, such as join and coverage. Other operations are analogous to set operations.
Below, each interval operation is described in detail. You can also view screencasts showing an actual "clicking pattern" through the Galaxy interface (note screencast link below each subheading). The examples shown in screencasts use coordinates of coding exons and transposable elements from chromosome 22. This screencast shows how to upload these coordinates.
Intersect
(Download Intersect Screencast)
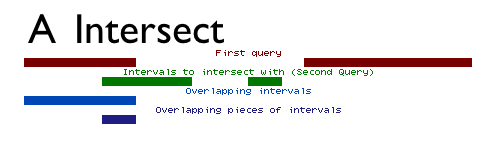
Intersect allows for the intersection of two queries to be found. The intersect tool can output either the entire set of intervals from the first dataset that overlap the second dataset (e.g. all exons containing repeats), or just the intervals representing the overlap between the two datasets (e.g. all regions that are both exonic and repetitive; see Figure above).
When finding entire intervals (by setting Return to Overlapping Intervals), the order of the datasets is important. The operation will output all of the intervals in the first query that overlap any interval in the second query. It can also be thought of as a filter: intervals that do not overlap any interval in the second query will be removed.
When finding pieces of intervals, or the regions representing the overlap between the two datasets (by setting Return to Overlapping Pieces of Intervals), the output will be the intervals of the first dataset with the non-overlapping subregions removed.
Subtract
(Download Subtract Screencast)
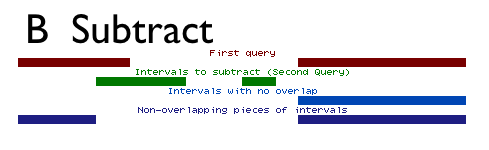
Subtract does the opposite of intersect. It removes the intervals or parts of intervals in the first dataset that are found in the second dataset (Figure above). Like Intersect, Subtract can treat intervals as a whole, removing or keeping entire intervals, or it can break them apart, removing overlapping subregions.
As with arithmetic subtraction, the order of the datasets is important. The second dataset is subtracted from the first dataset. The output is a variation of the first dataset and all of its columns. When subtracting whole intervals (by setting Return to Intervals with no overlap), the output will be the intervals of the first dataset that do not overlap any part of intervals of the second dataset.
When subtracting overlapping subregions (by setting Return to Non-overlapping pieces of intervals), the output will be the intervals of the first dataset with the overlapping subregions removed.
Merge and Concatenate
(Download Merge and Concatenate Screencast)
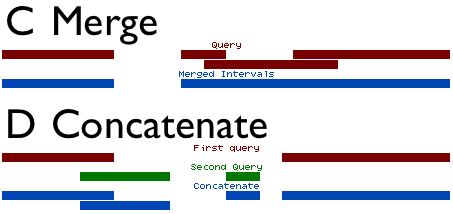
Concatenate and Merge are analogous to addition and union (figure above). They can be used together to combine datasets and merge (or flatten) the intervals.
Concatenate simply combines two interval datasets. The option Both queries are exactly the same filetype indicates that columns in both datasets are the same. If this option is unchecked, then the second dataset is adjusted to match the column assignments of the first. However, since the columns chromosome, start, end, and strand are the only columns used by the operations, all other columns will be replaced in the second dataset with a period(.). Typically this option is left checked, as BED files are the typical interval format used within Galaxy.
Merge reads a dataset, and combines all overlapping intervals into single intervals. When merging intervals, all columns besides chromosome, start, and end are lost. When two intervals are combined into one, it is ambiguous what the other columns represent or which field should be carried over to the resulting interval. For this reason, all columns except for chromosome, start and end are omitted from the output.
Concatenate combines datasets, and has the ability to combine interval datasets of different types. Merge combines overlapping intervals into single intervals. Together, the two operations can be used to combine intervals from different datasets into simple regions.
Base Coverage
(Download Base Coverage and Complement Screencast)
The base coverage tool calculates the number of bases covered by all of the intervals in a dataset. It does not count overlapping bases more than once; if there are two intervals referring to the same region, those bases are counted only once.
Complement
(Download Base Coverage and Complement Screencast)

Complement inverts a dataset (Figure above). Complement reads in all of the regions of a dataset, and outputs the regions not covered by any intervals in that dataset. The option Genome-wide complement allows for the entire genome to be complemented, regardless of whether a chromosome, contig, scaffold, etc. is represented in the query dataset. In a genome-wide complement of a dataset, any chromosome that has no intervals in the query dataset will be output in the result as the entire chromosome. In a normal complement, only the chromosomes, contigs, scaffolds, etc. that are referenced in the query dataset will be represented in the output.
When complementing a chromosome, the length of the chromosome is needed. Galaxy uses the chromInfo tables available through the UCSC Table Browser for this information. For complements on builds not available through UCSC, a default chromosome length of 512 megabases is assumed.
The resulting dataset will contain intervals representing regions that are NOT transposable elements. Also, a normal complement is done in contrast to a genome-wide complement because when obtaining the simple repeats, chromosome 22 was explicitly specified, and the other chromosomes were explicitly omitted.
Coverage
(Download Coverage Screencast)
Coverage is a combination of intersect and base coverage. Coverage finds the number of bases each interval in the first dataset covers of the second dataset. In addition, it finds the fraction of the interval's total length that covers intervals in the second query. The resulting dataset is all of the intervals from the first input dataset, with two columns added to the end: bases covered and fraction covered. The additional two columns can be manipulated with other tools such as “Filter” under the “Filter, Sort, Join and Compare” section of the toolbox or with “Compute” under the “Edit Queries” section of the toolbox. Below is the example:
If Query1 are genes
        chr11 5203271 5204877 NM_000518 0 -
        chr11 5210634 5212434 NM_000519 0 -
        chr11 5226077 5227663 NM_000559 0 -
        chr11 5226079 5232587 BC020719  0 -
        chr11 5230996 5232587 NM_000184 0 -
and Query2 are repeats:
        chr11      5203895 5203991 L1MA6     500 +
        chr11      5204163 5204239 A-rich    219 +
        chr11      5211034 5211167 (CATATA)n 245 +
        chr11      5211642 5211673 AT_rich    24 +
        chr11      5226551 5226606 (CA)n     303 +
        chr11      5228782 5228825 (TTTTTG)n 208 +
        chr11      5229045 5229121 L1PA11    440 +
        chr11      5229133 5229319 MER41A   1106 +
        chr11      5229374 5229485 L2        244 -
        chr11      5229751 5230083 MLT1A     913 -
        chr11      5231469 5231526 (CA)n     330 +
the Result is the coverage density of repeats in the genes:
        chr11 5203271 5204877 NM_000518 0 - 172   0.107098
        chr11 5210634 5212434 NM_000519 0 - 164   0.091111
        chr11 5226077 5227663 NM_000559 0 -  55   0.034678
        chr11 5226079 5232587 BC020719  0 - 860   0.132145
        chr11 5230996 5232587 NM_000184 0 -  57   0.035827
For example, the following line of output:
chr11 5203271 5204877 NM_000518 0 - 172 0.107098
implies that 172 nucleotides accounting for 10.7% of this interval (chr11:5203271-5204877) overlap with repetitive elements.
Cluster
(Download Cluster Screencast)

Cluster is one of the most versatile and powerful interval operations (figure above). Cluster finds clusters of intervals, and has a wide range of behavior depending on the options specified. The Maximum distance parameter specifies the maximum distance allowed between regions for those regions to be considered a cluster. Maximum distance can be a positive number, zero, or a negative number:
- When maximum distance is a positive number, regions that are at most that distance from each other are considered to be a cluster.
- When maximum distance is zero, cluster considers intervals that are touching to be a cluster. This is similar to the behavior of the merge tool, but is more flexible and specific.
- When maximum distance is a negative number, intervals that have that amount of overlap are considered to be a cluster.
A cluster will be ignored unless it has at least as many intervals within it as specified by the parameter Minimum intervals per cluster. If this is set to 1 or lower, then all intervals, even single intervals that do not cluster with any surrounding intervals, are included in the output.
Cluster has three options for output as found in the drop-down list Return type: Merge clusters into single intervals, Find cluster intervals; preserve comments and order, and Find cluster intervals; output grouped by clusters:
Merge clusters into single intervalsfinds all of the clusters according to the criteria set by maximum distance and minimum intervals per cluster, and outputs the start and end of each cluster as an interval. The result is that clustered intervals become one large, continuous interval spanning all of the intervals within that cluster. Setting maximum distance to 0 and minimum intervals per cluster to 1 with this option produces exactly the same output as the Merge tool.Find cluster intervals; preserve comments and orderfinds all of the clusters according to the criteria set by maximum distance and minimum intervals per cluster, and outputs those intervals in the original order they were encountered in the input dataset. This option can be thought of as a filter that removes the intervals that are not found within a cluster.Find cluster intervals; output grouped by clustersfinds all of the clusters according to the criteria set by maximum and minimum intervals per cluster. It is the same as the previous option, except that the intervals are grouped together in the output by cluster.
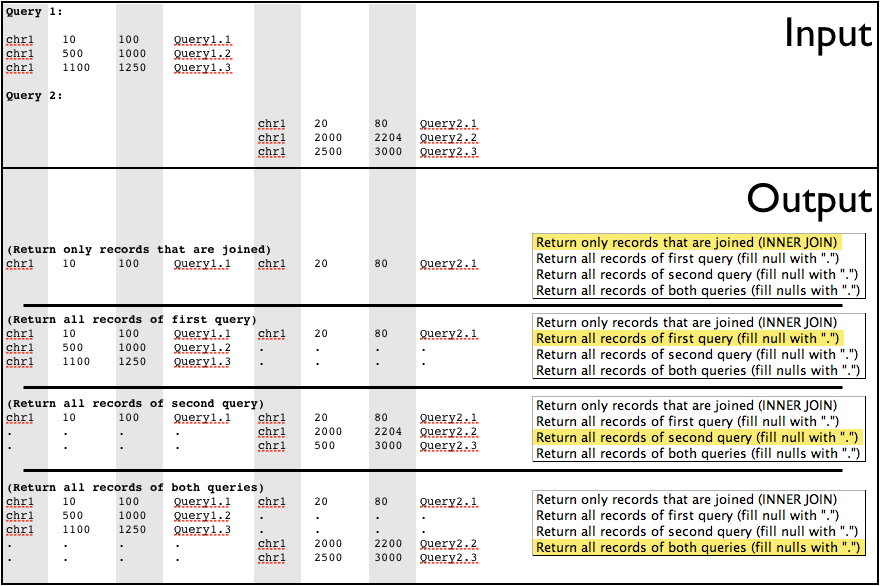
Join
(Download Join Screencast)
The join operation is similar to joins done by database management systems such as MySQL (figure below). Join looks at two datasets of intervals, and joins them based on interval overlap. Any interval in the second dataset that overlaps an interval in the first dataset will be appended to the line from the first dataset and output.
Like intersect, join allows a minimum overlap to be specified. Intervals must exceed the minimum overlap to be joined. Several types of join can be done. These are specified by the drop-down list labeled Join Type (figure below):
Return only records that are joinedwill only return intervals in the first query that overlap and are joined to an interval in the second query. For users of SQL databases, this is similar to an “INNER JOIN”.Return all records of first query (fill null with '.')returns all intervals from the first query. Any interval in the first query that does not join an interval in the second query will have the extra fields padded with a period (.).Return all records of second query (fill null with '.')returns all intervals from the second query. Any interval in the second query that is not joined to an interval in the first query will have fields filled in with a period (.). Because the intervals are filled in with a period, this may output an invalid interval dataset. Further operations on the resulting dataset may not be possible, since chromosome, start, and end will be replaced with a period, which is not a valid value.Return all records of both queries (fill nulls with a '.')returns all of the intervals from both queries. Intervals that do not join have fields filled in with a period (.). As with the previous option, this could result in an interval dataset with a period in the chromosome, start, and end fields. This would result in a dataset that cannot have any further operations performed on it. All "flavors" of join are shown in the figure below.
Each output option is illustrated here. Notice that in the last two options/examples intervals with invalid chromosome, start, and end are output, rendering those datasets no longer usable without filtering out the invalid intervals.